Mindfulness using CBT, data and technology


I have been working on some product prototypes on developing technology for behavioral health and wish to jot down my thoughts here on possibly helpful e-solutions that may benefit users on a regular basis. My idea is about digital health interventions based on the following premise.
Although I am a strong advocate of encouraging people to move into deep Amazon rainforests, build huts and meditate for the rest of their lives, I understand that some of us like to lean on the other Amazon a lot more :). Whichever Amazon you choose if you seek health and happiness I do wish for all to get as much benefit as possible.
Data Visualization
The biggest advantage of using technology is the brilliant value data visualizations add to our attention/retention deficit minds. If I had to describe data visualization in simple words it would be this- being able to see a juggernaut of information in a way that makes sense. If you get a Eureka moment while looking at your data, someone has done a brilliant job of the visualization! There is always an ideal user for each product, but in this case most solutions will work in some way for all who agree to struggle somewhat with the mind. The main theme behind it all is what the old wisdom has taught us time and again and what is fundamentally key to mental health and happiness- Self Awareness and Practice.
Data – by the self, to the self and for the self
What if we could glance at our minds just like we watched the movies? Remember watching the beautiful animation movie- Inside Out? The movie showcases all our emotions and neuro-bio-chemicals (serotonin and such) as if they were larger than life characters having personalities of their own helping us understand the role they play in the functioning of our minds as we follow the story-line. Dint you feel a little wiser about yourself when you walked out of the movie theater that day? What if we could do this for real? What if we could see our heroic-ness or timidity in great detail on a dashboard of beautiful visualizations, bubble charts or histograms as and when we liked? (Of course when nobody is watching ;)) In other words- see ourselves unravel over time! Does this sound interesting? Wouldn’t this be a whole new level for the Selfie? There is a caveat… yes. We will have to do some work.
With the relentless market and data science focus on acquiring and retaining our business customers, how about this also lean strategy for acquiring and retaining the customer of self.
Color coding our emotions
I found this particular chart very interesting to be used as a data visualization tool by various aspects- color coding, hex, visual – and simple Python coding.
import numpy as np

from bokeh.io import output_file, show
from bokeh.plotting import figure
from bokeh.transform import linear_cmap
from bokeh.util.hex import hexbin

n = 50000
x = np.random.standard_normal(n)
y = np.random.standard_normal(n)

bins = hexbin(x, y, 0.1)

p = figure(title="Manual hex bin for 50000 points", tools="wheel_zoom,pan,reset",
           match_aspect=True, background_fill_color='#440154')
p.grid.visible = False

p.hex_tile(q="q", r="r", size=0.1, line_color=None, source=bins,
           fill_color=linear_cmap('counts', 'Viridis256', 0, max(bins.counts)))

output_file("hex_tile.html")

show(p)
An example application and sketch of such a hex chart is-
(Original source code- https://docs.bokeh.org/en/3.0.2/docs/user_guide/topics/hex.html)
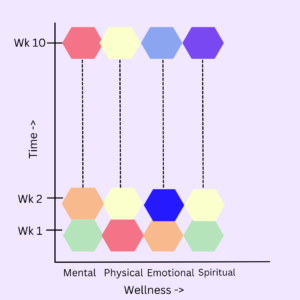
We can define a color code where each color can mean a certain level of wellness- for example Color code = [yellow= Bright, blue = Sad, Dark blue = Depressed, Red=Angry, green=Happy]. The size of the hexagon can also express the intensity of the emotion.
We can examine different aspects of our life and rate how we feel about each one of them – like physical wellness, mental wellness, spiritual wellness, social connectedness, financial stability etc and then plot them as a whole in this chart. We can also relate each one of these levels to factors responsible for them- like Friends for social connectedness, Cooking for Happiness. The color dominance in our chart can be used to reflect overall wellness- like mostly yellow can mean Brightness in our lives. We can keep checking these over a period of time to see how different factors influence our happiness- some may be easy to guess and some may not. Then we can build our life around it.
A proposed CBT (Cognitive Behavioral Therapy) Progress Chart
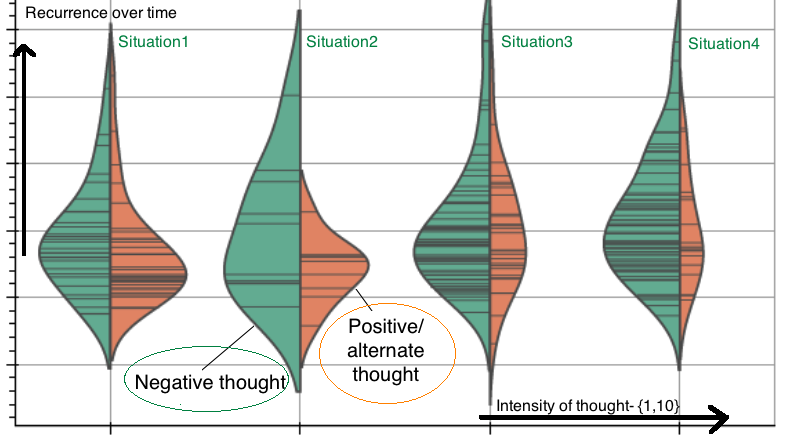
Bokeh Violin chart (https://docs.bokeh.org/en/0.10.0/docs/gallery/violin.html) implemented as a CBT (Cognitive Behavioral Therapy) progress chart.
import seaborn as sns

from bokeh import mpl
from bokeh.plotting import output_file, show

tips = sns.load_dataset("tips")

sns.set_style("whitegrid")

# ax = sns.violinplot(x="size", y="tip", data=tips.sort("size"))
# ax = sns.violinplot(x="size", y="tip", data=tips,
#                     order=np.arange(1, 7), palette="Blues_d")
# ax = sns.violinplot(x="day", y="total_bill", hue="sex",
#                     data=tips, palette="Set2", split=True,
#                     scale="count")
ax = sns.violinplot(x="day", y="total_bill", hue="sex",
                    data=tips, palette="Set2", split=True,
                    scale="count", inner="stick")
# ax = sns.violinplot(x="day", y="total_bill", hue="smoker",
#                     data=tips, palette="muted", split=True)
# ax = sns.violinplot(x="day", y="total_bill", hue="smoker",
#                     data=tips, palette="muted")

# planets = sns.load_dataset("planets")
# ax = sns.violinplot(x="orbital_period", y="method",
#                     data=planets[planets.orbital_period < 1000],
#                     scale="width", palette="Set3")

output_file("violin.html")

show(mpl.to_bokeh())
We can use the above chart in a scenario like this- I have a few situations in my life where I think obsessively, negatively and worry too much. My psychologist asks me to practice CBT to become aware of my patterns and create space for some positive thinking or alternate thinking and behaviors. Let there be 4 situations where I lose my mind- My exams, my arguments with my professor, my illness and my future. I practice CBT daily on these four situations noting my negative obsessive habitual thoughts, as well as possible and positive, alternate thoughts. As I observe my situations that give me the opportunity to practice alternate thinking I note how many times I was able to repeat myself (negative thought) and how many times I was able to practice my alternate thought. Once I start practising CBT let’s assume I am still negative 15 times but positive 4 times. I also note the intensity of my emotions- how negative or how positive I feel with those situations.
Once this data is available the chart like above is plotted where I can see a visualization of my mind’s habit patterns and also observe how much progress I made – plotted in green are the negative ones and brown, positive ones. I am also able to see if I was able to achieve any balance in my view or thinking – for example in the above chart the first (leftmost) situation depicts more balance between green and brown and the last (rightmost) shows the most imbalance- very negative and repetitive thoughts, very little positivity and very low frequency of positive thought.